

KODUPABER AS
Business media and news feed
?
Business media page visits - 5190; followers - 58. Reviews - 1; Articles 1+ "Write an opinion on KODUPABER AS!"
Tegevuslugu
Ettevōtte juhtkond, meeskond ja kontaktid
KODUPABER AS hetkeolukord

Already 5,190 people have seen this company's branding and they are being followed by 58 Storybook user.In average the company has been rated 4.4 points ja kommenteeritud 6 korda.
's activity report 2022
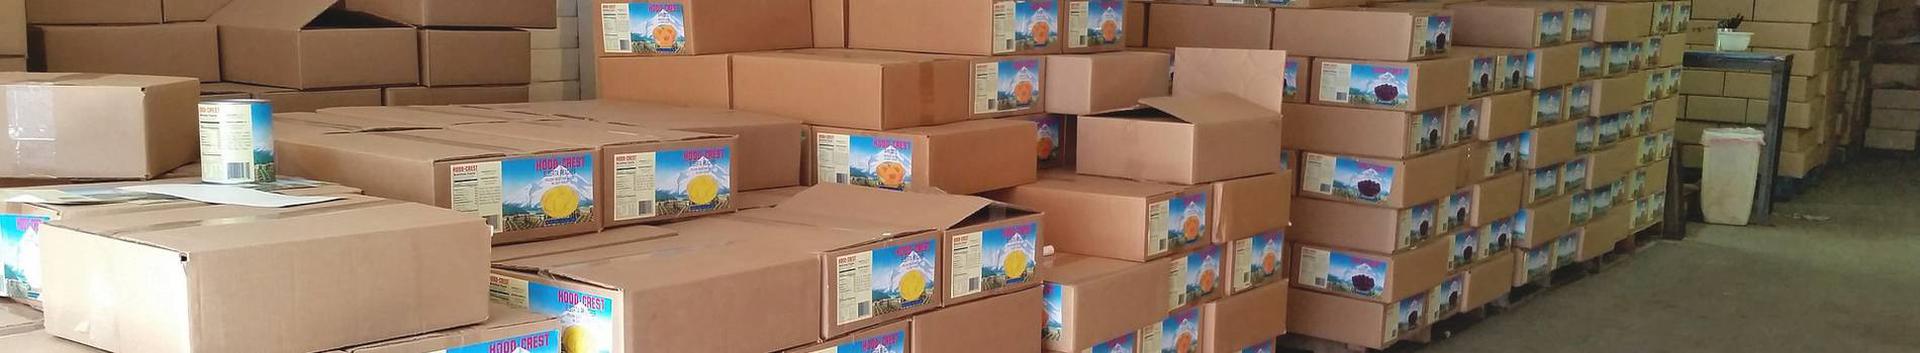
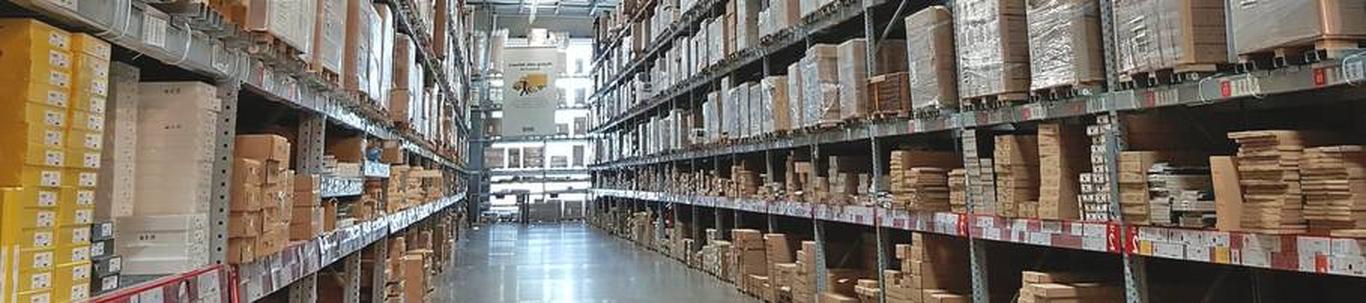
AS Kodupaber provides sales and logistics services in three customer segments - retail companies, business customers and pharmaceutical wholesalers.
The products offered from well-known manufacturers such as Johnson&Johnson, Essity, GoldenLady, Mayeri, Huhtamaki, Grigeo etc. are in demand in different customer groups and allow to create synergy in terms of a wide range of products and efficient logistics.
The profit for 2022 was 552 thousand euros. The largest part of the increase in operating costs was made up of energy costs and marketing costs.
In the opinion of the company's management, changes in exchange rates and stock prices during the reporting period did not have a significant impact on the company's operations.
Hedging instruments are not used.
The goal for 2023 is to maintain stability in the sales and profitability of existing customer segments.
Main financial ratios 2022 2021
Sales revenue growth 16.8% -1.6%
Solvency ratio 0.5 0.4
Operating profitability 2.8% 0.3%
Net profitability 2.7% 0.2%
Short-term obligations coverage ratio 2.0 1.9
Return on assets (ROA) 6.9% 0.5%
Return on equity (ROE) 13.7% 1.1%
Asset turnover 2.6 2.2
Financial leverage ratio 2.0 2.2
Sales revenue growth (%) = (sales revenue 2022 - sales revenue 2021) / sales revenue 2021 * 100
Solvency ratio (times) = equity/assets
Operating profitability (%) = operating profit / sales revenue * 100
Net profitability (%) = net profit / sales revenue * 100
Short-term obligations coverage ratio (times) = current assets / short-term obligations
ROA (%) = net profit / average assets * 100
ROE (%) = net profit / average equity * 100
Asset turnover (times per year) = net sales realization / average assets
Financial leverage ratio (times) = average assets / average equity
KODUPABER AS contacts
Cooperation partners
The company's biggest cooperation partners
Add a new partner
EE- Estonia


Dropdown
File a complaint
Choose the comment attribute that you think it contains:
You want to report an inappropriate comment.
Are you sure?
Are you sure you want to delete this article?